What are thermodynamic properties? How they related to ideal gases and water?

Instructional videos

Thermodynamic properties are central to capturing energy changes in substances. Ideal gases and water are common working fluids in engineering. These videos describe what these properties are and how they are related to one another. The relationships are mapped on a property chart. Property charts are useful for solving thermodynamic problems. Use these videos to supplement your learning.

Behavior of ideal gases

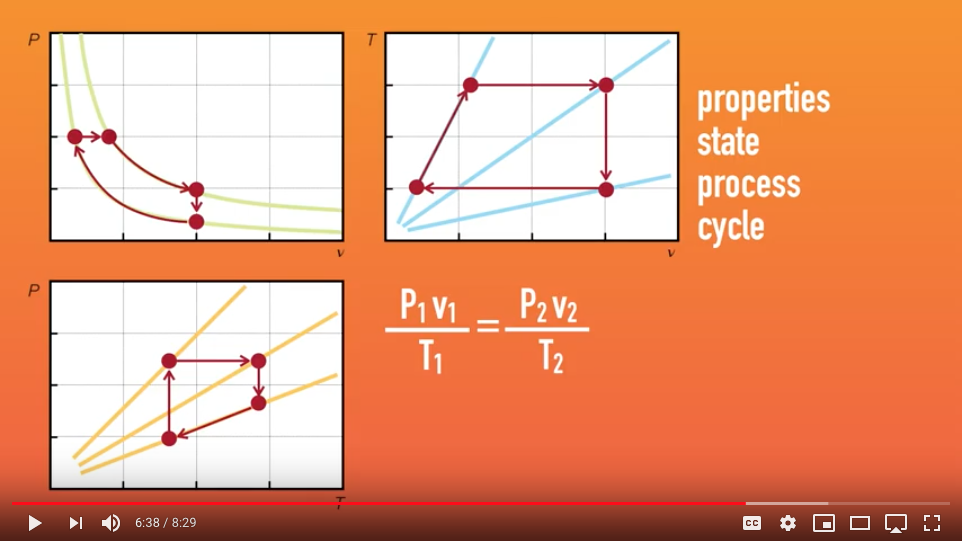
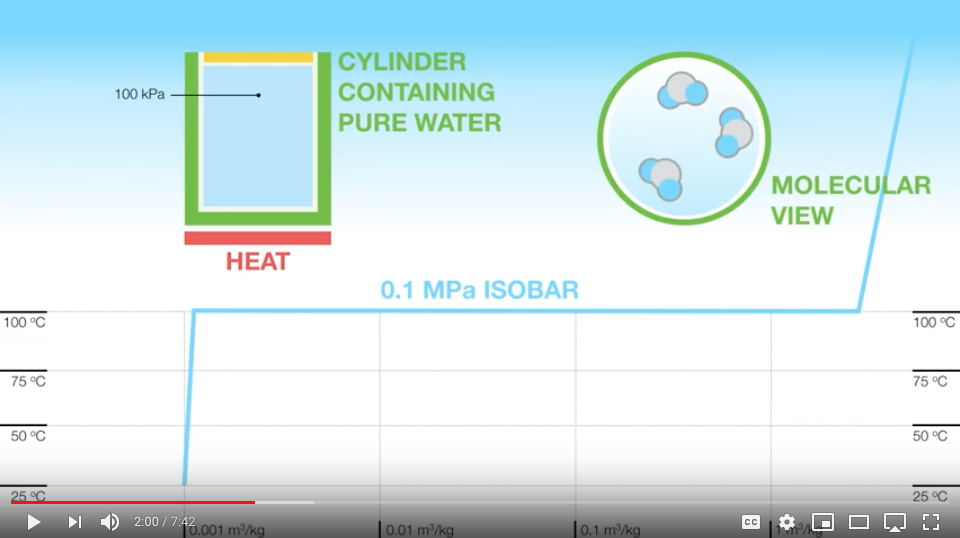
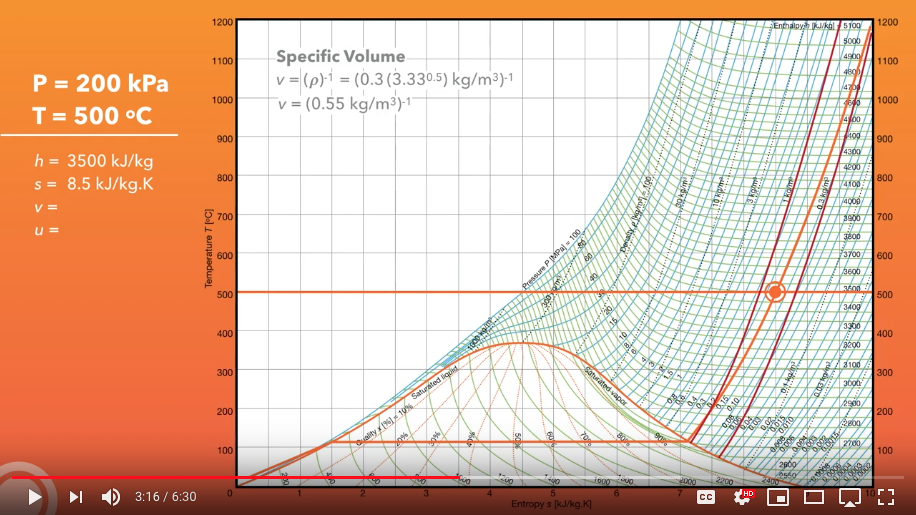
We use gases in numerous engineering processes and therefore need to predict their behavior as we change pressure and temperature. Ideal gas law is an important tool in predicting gas behavior that is central to the study of engineering Thermodynamics. Here we look at how ideal gas model can be used to study common gases and where it might break down. We use property charts to visualize their behavior and also recognize their limitations.

Properties of Water

Water is an important working fluid for power generation. Understanding its thermodynamic properties, retrieving these properties from a database and performing analysis is central to the study of engineering Thermodynamics. This video emphasizes the role property charts can play in thermodynamic analysis involving water. Property charts focus on property trends rather than their values.

Using Property Charts

Learn how to use property charts to quickly retrieve thermodynamic properties of water without steam tables. Property charts focus on property trends rather than their values and allow us to visualize critical engineering processes.

Video Playlist

Play all the videos in a sequence. This playlist begins with ideal gas discussion and proceeds to water properties. Linking the two is a visual key to emphasize the connection between thermodynamic properties of substances.

Charts

Check out a live web-based Temperature-Entropy chart for water. Download a colorful paper-based chart.

Learn

Learn what thermodynamic properties of water are and how they are related to the ideal gas model.

Evidence

How do property charts improve student learning outcomes? What is the impact?